
The United Kingdom is an ageing country. This doesn’t just mean that people are living longer, which they are; it also means that the birth rate has dropped significantly in recent decades. These two factors are important when considering issues like state pensions. In the UK, the state pension follows a pay-as-you-go (PAYG) model. This means that pensions are paid from tax levied on the working population. In theory (although it used to be in practice as well), this is partly what National Insurance contributions (NICs) are for. Incidentally, this is one of the reasons that NICs have not been rolled into income tax, as it would seem harsh for pensioners to partly fund the pensions they are already receiving.
Anyway, the ratio of the retired to the working population is a direct reflection of the affordability of benefits such as the state pension. This ratio is known as the old age dependency ratio (OADR). As can be seen below, the UK is not in a great position in an international context.
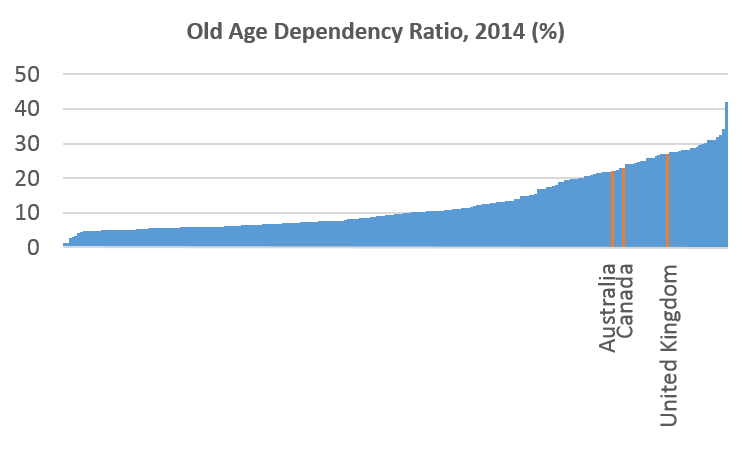
Source: World Bank
The OADR for the UK is around 27%. This means that there are fewer than four people of working age (or at least aged 16 to 65) for each person of retirement age (or at least over age 65). Now whilst this is nowhere near as high as Japan’s OADR of over 40% – that’s 10 workers to every 4 retirees, and the line on the right of the chart – it is high relative to a couple of our commonwealth contemporaries, Australia and Canada, both of which have an OADR of around 23%. And difference has persisted since at least 1960, as shown below.
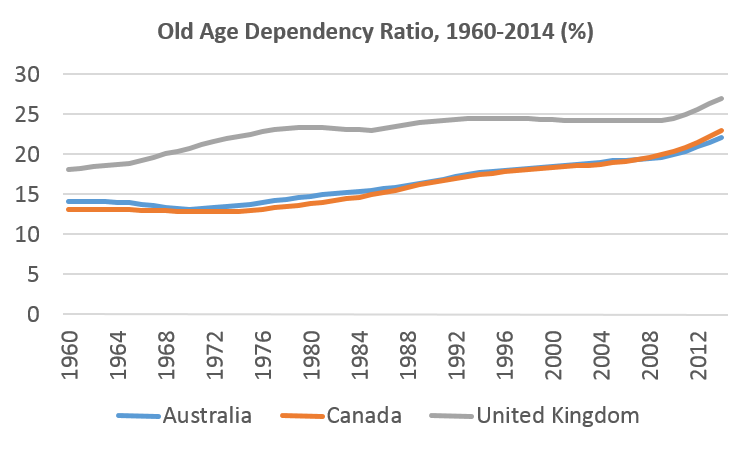
Source: World Bank
This suggests that Australia and Canada are better placed than the UK to meet the financial needs of their retirees – from a demographic perspective, at least. So what might the reason for this difference be? Perhaps it is life expectancy. If the UK had a higher life expectancy than Canada or Australia, then this might lead to a higher OADR – after all, a higher life expectancy would be consistent with people spending longer in retirement. However, as we can see below, the UK has a lower life expectancy than either Canada or Australia. Indeed, this has been the case for at least four decades.
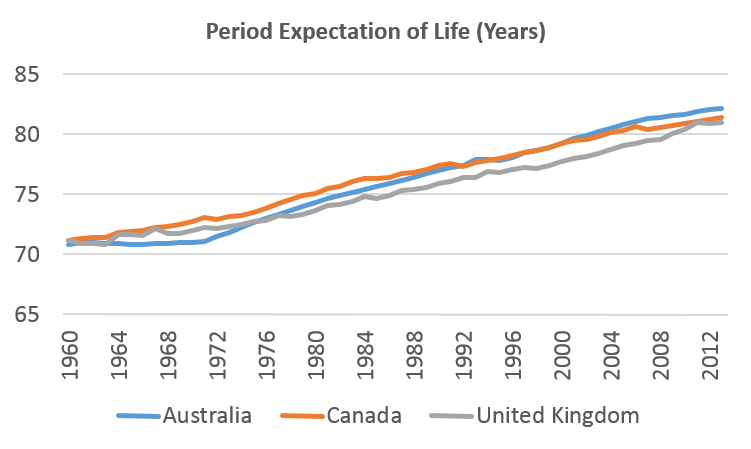
Source: World Bank
If life expectancy isn’t the cause, how about births? If the UK has had a consistently lower fertility rate – that is, a lower number of children per mother – being born over the last few decades, then this would translate to a relatively smaller working population. But again, as we can see below, this simply isn’t the case. The UK’s fertility rate has been on a par with that of Australia since around 1980. It was also on a par with that of Canada from the mid 1960s – until Canada’s fertility rate drifted lower than that of the UK from 1980 onwards.
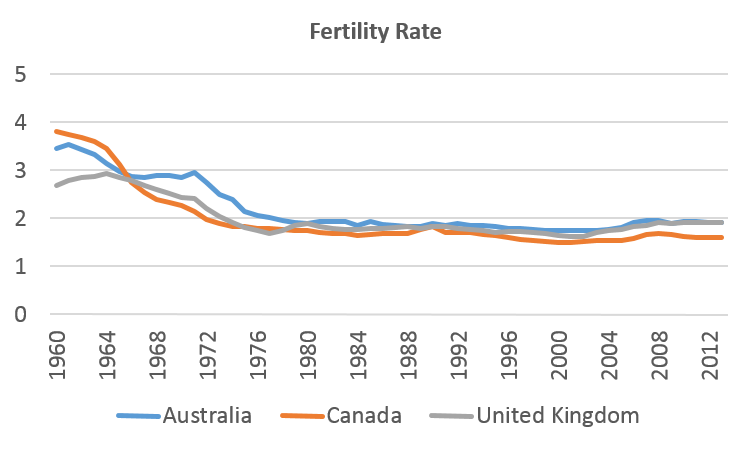
Source: World Bank
What, then, is the cause of the lower OADRs of Canada and Australia? A good candidate is migration. As seen below, Canada and Australia have had consistently higher levels of immigration relative to the UK. In essence, these countries have been using immigration to compensate for their low birth rates.
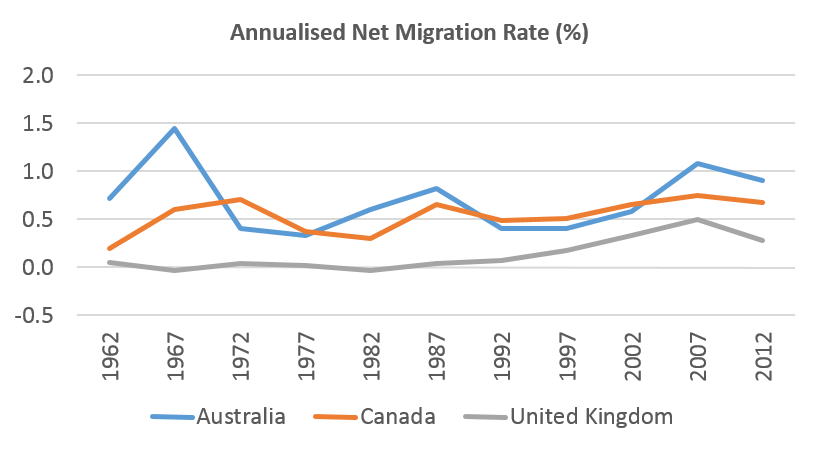
Source: World Bank
Not only do these higher levels of immigration increase the size of the workforce relative to the retired population, but they also appear to have a positive fiscal impact relative. The levels of income tax as a proportion of GDP, shown below, show that both Australia and Canada are ahead of the UK in this regard. And this is with both Australia and Canada having a higher GDP per capita than the UK. Is this due to Australia and Canada having significantly higher rates of income tax than the UK? Well, Australia’s rates are broadly similar, with top rates of 45%. In Canada, the system of federal and provincial taxes makes comparison more difficult. The top federal rate is only 33%, but taxes in some provinces can push rates for some high earners over 50%. Having said this, an OECD comparison of the average personal income tax rate still had the UK down as being higher than both Canada and Australia.
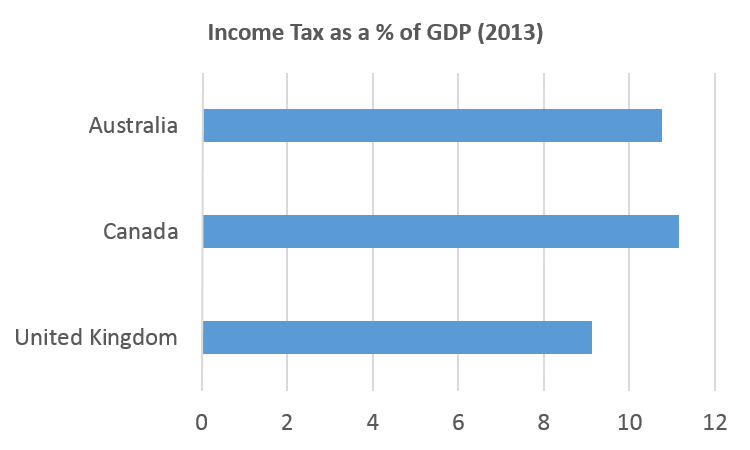
Source: OECD
Might this be hiding differences in indirect taxes such as GST/VAT? No – VAT is 20% in the UK, whilst GST is 10% in Australia. In Canada provincial differences again make things more complicated, but even in most heavily taxed provinces the total level of GST is no more than 15%. But that’s missing the point – higher immigration seems to bring in more income tax for a government without necessarily requiring higher rates of tax.
There is clearly more to immigration than the question of the OADR. However, with an ageing population and a significant state pension burden, it is important to recognise the positive financial impact that immigration can have.
![]()