
The referendum on the UK’s membership of the EU is now only a few days away. This means that there is more focus than ever on the opinion polls. But as well as these polls, we also have the odds on the referendum being quoted by a large number of bookmakers – and at first sight, the two might not seem to tally.
As of Sunday evening, the latest opinion poll was showing 45% intending to vote to remain, 42% intending to vote for Brexit and 13% being undecided. Allocating the 13% undecided in proportion to the “yes” and “no” camps means it was about 52% for remain and 48% for Brexit. But at the same time, some bookmakers were giving odds to remain of 1-3. That implies a likelihood of 75% that there will be a vote to remain in the EU. How can such a tight race give rise to the perception of an odds-on outcome?
The polls and the odds can be reconciled by recognising that betting odds allow for two things: the expected proportion voting “yes”, and the uncertainty around this. A couple of simple thought experiments can demonstrate this. First, imagine that it’s the day before the referendum, and you know for certain that 52% of the electorate will vote to remain. What odds would you offer someone that wanted to place a bet that the UK would remain in the EU? 1-2? 1-3? 1-50?
If you were indeed certain that 52% of the votes would be in favour of remaining, even a 1-1000 bet – where you would pay out £1 for every £1,000 that was bet – would be poor value to offer: you’d still be paying out and making a loss.
Now, imagine instead that you believed that 75% would vote to remain, but in reality you were much less certain. You might offer odds of 1-3, but you might offer 1-2, or something completely different. But the key point is that the odds would be driven not just by your expectation of the proportion voting “yes”, but also by your confidence in this expectation.
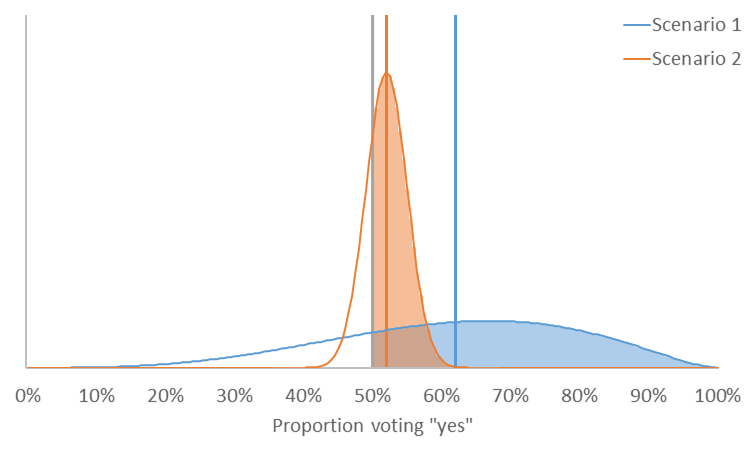
This can also be demonstrated graphically. In the chart below, there are two scenarios. In scenario 1, the expected proportion voting “yes” is 62%. When the uncertainty around this estimate is analysed, it appears that there is a 75% chance that more than 50% of the votes cast will be for “yes”. Compare this with scenario 2. Here, the expected proportion voting “yes” is only 52%. However, the confidence in this estimate is much greater. This means that there is still a 75% chance that more than 50% of the votes cast will be for “yes”. Scenario 2 is one interpretation of the current state of play in the polls and in betting markets.
So how might one arrive at these estimates in practice? It could be approached a bit like credit portfolio modelling. A popular technique here is to look at the proportion of bonds in a portfolio with each credit rating, and then to use a transition matrix to work out which ratings bonds are likely to have at the end of the period. Translating this approach to a referendum, this would mean estimating not only the proportions of people currently planning to vote yes or no (or not knowing which way they will vote), but also the proportions that are likely to change their plans between now and the referendum. This is obviously more easily said than done.
This analysis does, of course, make two sweeping assumptions. The first is that the polls are reliable – and there are many reasons why this might not be the case. First, there are sampling issues. When a poll is carried out by phone or over the internet, there is an inherent bias to the sample that is chosen or, more importantly, responds. Allowances are made for this bias, but it is difficult to estimate. It is similarly difficult to estimate whether views expressed in an opinion poll will translate into votes. This is partly because people do not necessarily turn out to vote, but also because people do not necessarily tell the truth.
And there are also issues with the assumption that the odds reflect genuine beliefs of the outcome of the poll. Betting odds actually reflect the relative volumes of money being placed for and against a particular outcome. Whilst there is some evidence that those having “skin in the game” are likely to bet in accordance with their views, and a more general belief in the “wisdom of crowds”, they might still get it wrong. What’s more, those placing bets on the outcome will not necessarily have the same average views as the population as a whole – and this may be reflected in the odds. There might also be individuals placing bets to hedge some other risk to which they are exposed. However, it is easier to think of a bet for Brexit being used as a way of hedging tail risk than it is of a bet for Remain being used to hedge the short-term uncertainty of staying in the EU.
So there are many reasons why betting odds and opinion polls might diverge. But even before allowing for these factors, it should be clear that what might seem like a close race can actually give rise to significantly different odds in this referendum.
![]()